Through the Micro-Internship Programme at the University of Oxford, I was commissioned to build the evidence base for Wolvercote Young People’s Club (WYPC), which serves young people aged 8–24 in Wolvercote and Cutteslowe. This North Oxford area perceived as affluent but containing real concentrations of disadvantage invisible to standard area statistics. I tackled the Modifiable Areal Unit Problem, as many mixed Neighborhoods at the standard census level of granularity (LSOO) averages and washes out within-area inequality. I moved the analysis to the smallest available census unit, benchmarked all indicators against Oxford city, and was able to show how a street of social housing next to owner-occupied terraces registers as moderately deprived, erasing the circumstances of both populations.
Hidden deprivation score by Output Area
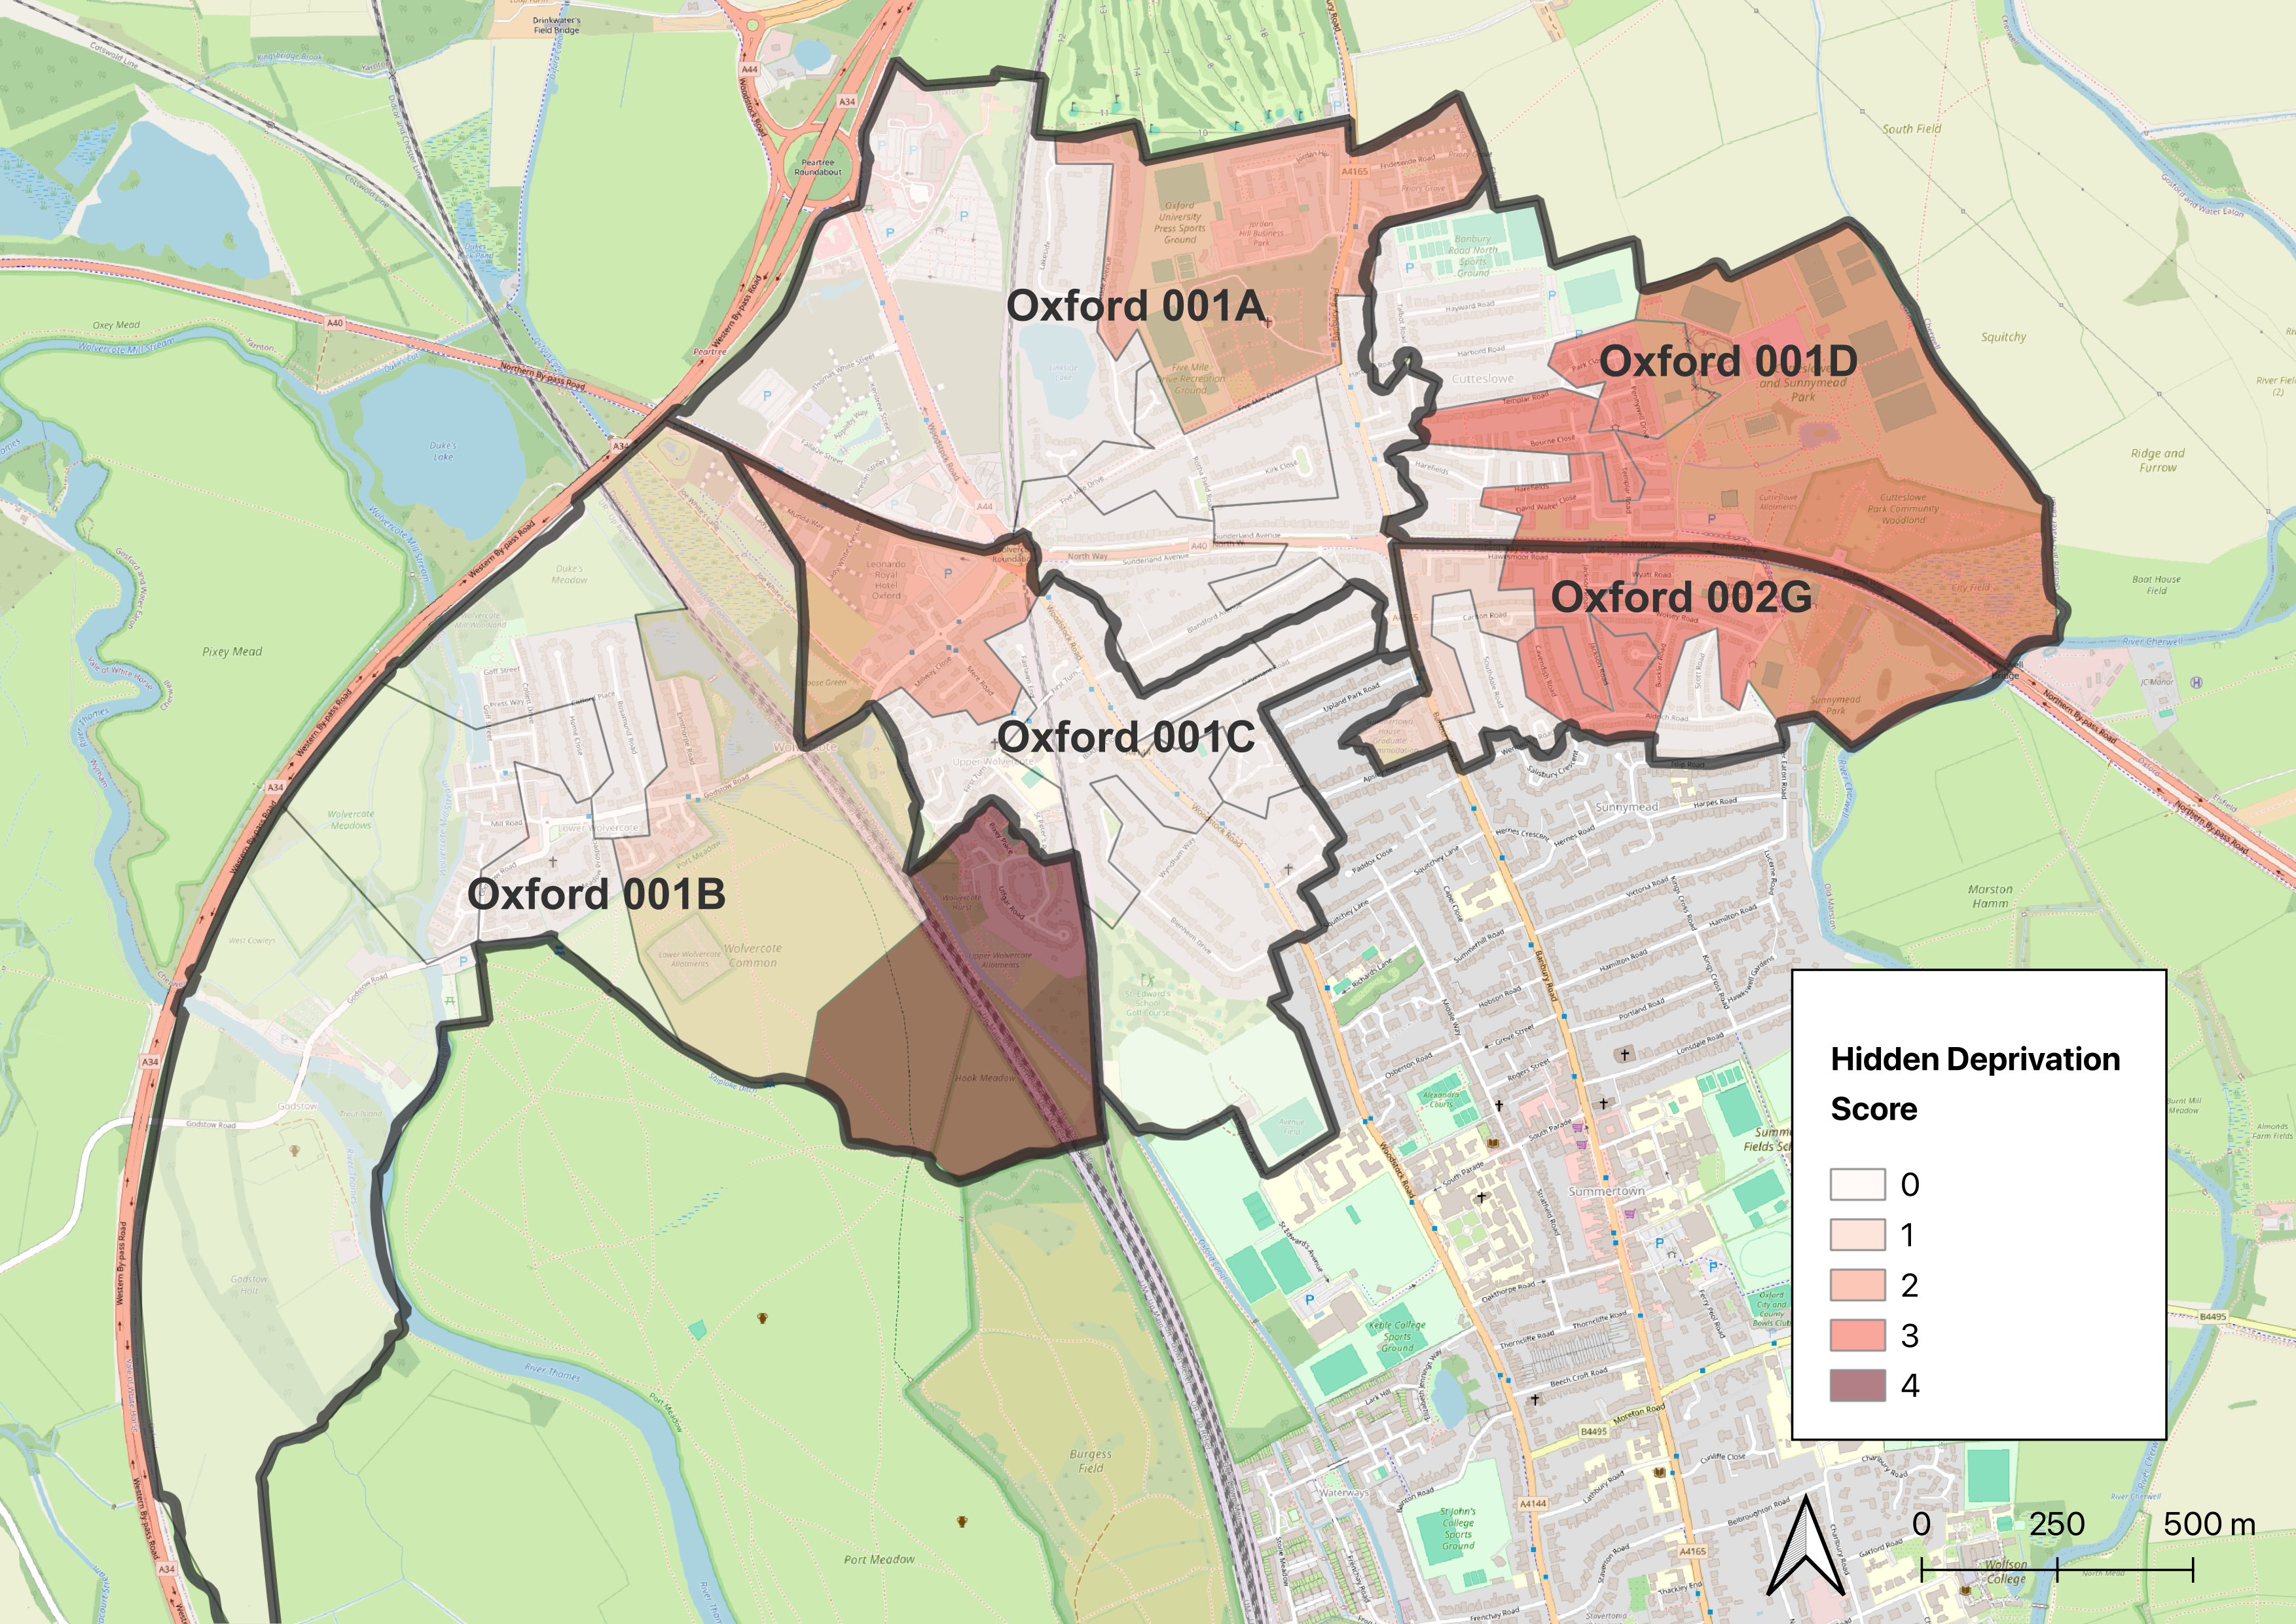
Each OA is scored on the number of census deprivation dimensions where it exceeds both the Oxford city average and its own LSOA average. High scores identify acute need masked by neighbourhood-level statistics.
LSOA-level (IMD 2025) vs. OA-level (Census 2021) — side by side
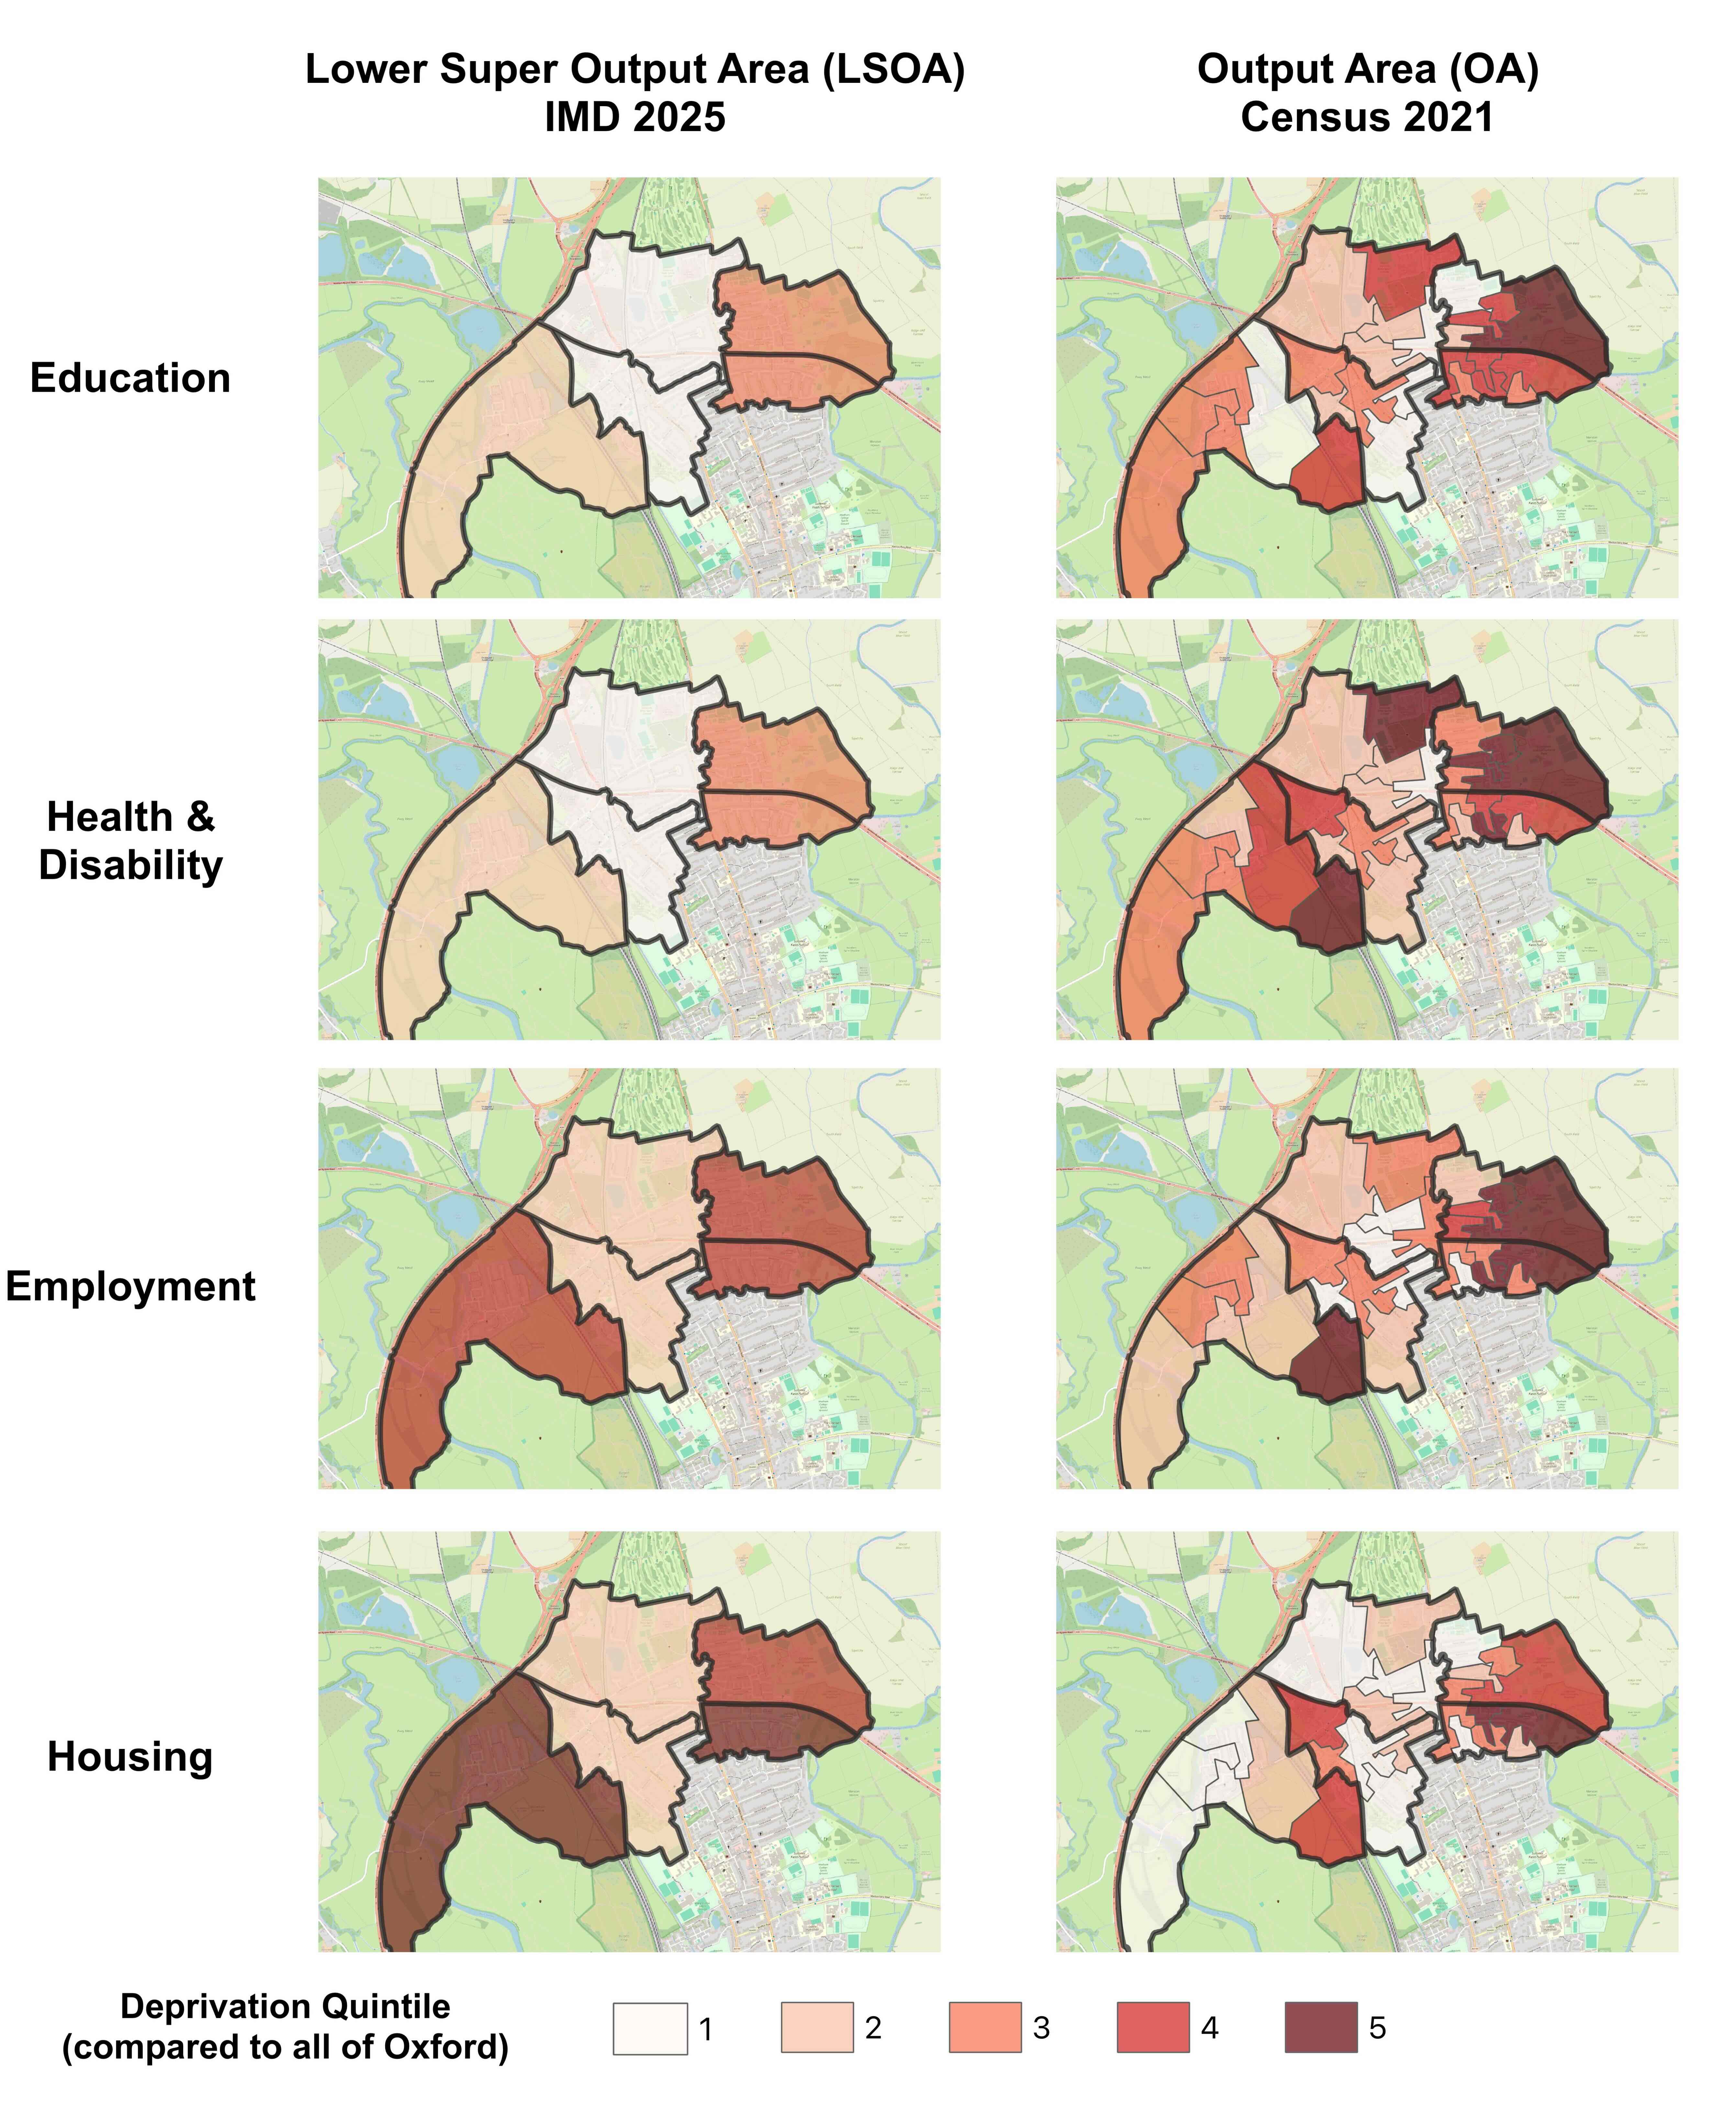
The divergence between the two columns illustrates how much within-LSOA variation is lost when analysis stops at neighbourhood level.
Key findings
Health deprivation ranged from below 20% to nearly 49% across OAs within the same neighbourhood. Social renting concentrated above 70% in specific OAs while approaching zero in adjacent streets. Several OAs in Oxford 002G (Sunnymead) scored 4–5 out of 5 on n_hidden — their deprivation worse than both the city and their own neighbourhood average, and invisible to standard analysis.
The report gave WYPC a spatially precise funding case: not “our area has pockets of deprivation” but a demonstration of exactly where, on which dimensions, and why standard statistics had been missing it.