In June 2023, I was in Toronto when the sky turned orange. My phone showed an air quality alert and my asthma flared up after not having any issues for many years. Because of my longstanding interest in climate and health, I wanted to figure out how bad it actually was and how we actually measure what happened to people’s health. What does the epidemiological infrastructure look like for an event like this? Who was the most affected, and did the public health response work? It started as coursework during my MSc in Epidemiology at Oxford and grew from there, informed by conversations with researchers at Public Health Ontario who were doing the same work at a much larger scale.
This project quantifies what the wildfires meant for the air that Greater Toronto Area residents breathed across the summer of 2023, using hourly PM2.5 monitoring data from Ontario’s MECP network and fire perimeter data from the Canadian National Fire Database.
The data
Two distinct smoke events hit the GTA that summer. The chart below shows daily mean PM2.5 averaged across ten Ontario MECP monitoring stations, May through July 2023. The WHO 24-hour guideline is 15 μg/m³; Ontario’s reference level is 27 μg/m³.
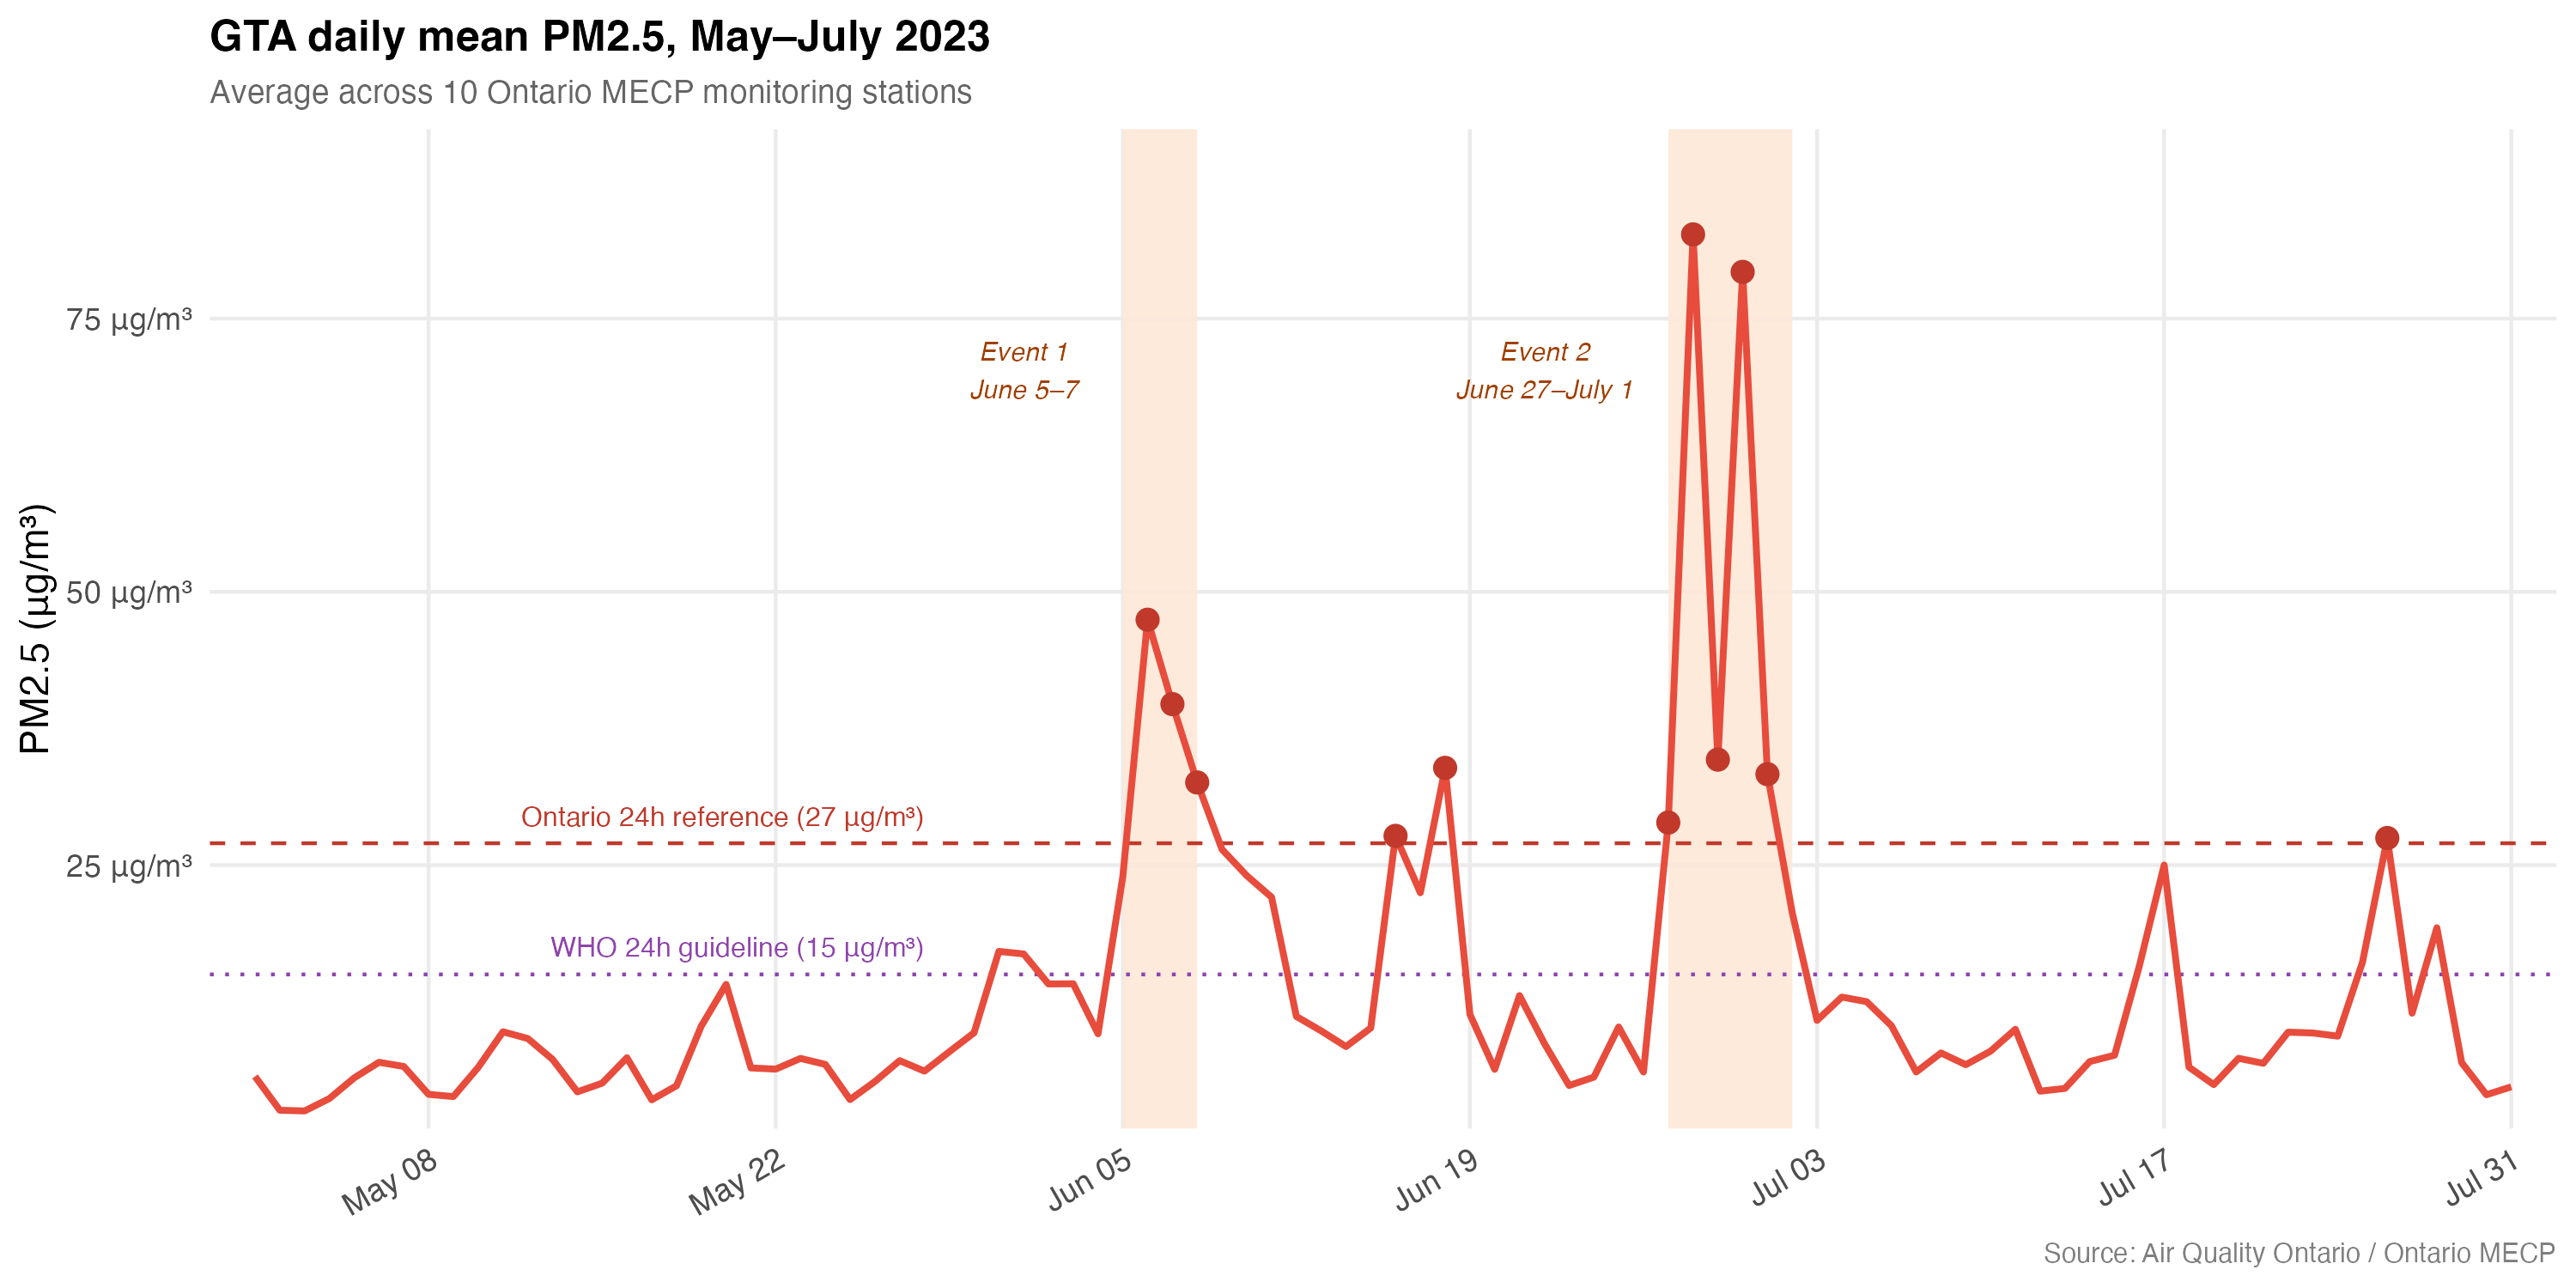
Source: Air Quality Ontario / Ontario MECP. WHO 24h guideline: 15 μg/m³. Ontario CAAQS reference: 27 μg/m³.
On baseline days, GTA mean PM2.5 rarely exceeded 15 μg/m³. During peak smoke days it exceeded 50 μg/m³ on a daily average, with individual station hourly peaks above 100 μg/m³ — more than ten times the WHO guideline. The first event was sharper and more concentrated, while the second was longer-sustained. They also differed in their health impact, as I discuss below.
The interactive map below shows peak PM2.5 at each station during both events. Toggle between events; zoom out to see where the fires were.
The second event recorded higher peak concentrations at most stations. For example, Brampton recorded its highest single-station reading of the summer (196µg/m³) during this event. However, it did not produce a proportionate surge in ED visits. A quasi-experimental study by Chen et al. (2025) from Public Health Ontario documented a 23.6% surge in asthma ED visits during Event 1 but found no consistent increase during Event 2. Their interpretation was that people who sought medications during the first event were better protected, and advisory adherence improved. This is a rare natural experiment with a built-in comparator. Direct evidence that timely risk communication, when acted upon, reduces acute burden. The harder question it raises is: acted upon by whom?
Public health implications
The epidemiological evidence linking PM2.5 to acute respiratory and cardiovascular outcomes is well-established. Emergency department visits for asthma exacerbations, COPD, and acute myocardial infarction all increase in the days following elevated PM2.5 events. Ontario’s own syndromic surveillance data from the 2023 season, analysed through the province’s ACES system and CIHI’s NACRS dataset, documented measurable increases in respiratory ED presentations during the June smoke events — the first major Ontario-specific evidence base of this kind.
Several features of wildfire smoke health risk make it distinct from other air quality threats:
- Transboundary and episodic: Unlike stationary industrial pollution, wildfire smoke arrives rapidly, with little warning, from sources hundreds of kilometres away. The standard monitoring and advisory frameworks were designed for local, predictable pollution sources.
- Differential vulnerability: Indigenous communities, older adults, people with pre-existing respiratory and cardiovascular conditions, outdoor workers, and newcomer populations with limited information access face disproportionate risk. Toronto and Peel Region, in particular, are among the most diverse populations in Canada, with large newcomer communities, which warrants targeted communication and intervention strategies.
- Cumulative seasonal burden: The 2023 season involved not one but multiple sustained exposure windows across May through July. Cumulative effects on lung function and cardiovascular health are poorly understood at the population level and represent a critical evidence gap.
As climate projections indicate that seasons like 2023 will become increasingly frequent, local public health units have a central role in translating this epidemiological evidence into actionable risk management: targeted advisories, equity-informed messaging, clean air space designation, and integration of wildfire smoke response into existing heat and air quality emergency frameworks.
Data and methods
All data are open-access and fully reproducible.
- PM2.5 monitoring data: Hourly readings from Ontario MECP’s AQHI monitoring network, accessed via Air Quality Ontario (
airqualityontario.com). Ten GTA stations used: Toronto Downtown, Toronto East, Toronto North, Toronto West, Brampton, Mississauga, Oakville, Milton, Newmarket, Oshawa. Daily means computed from hourly values with a minimum of 18 valid hourly observations. - Fire perimeter data: Canadian National Fire Database (CWFIS / Natural Resources Canada), large fires polygon dataset. Filtered to 2023; geometries simplified for web rendering. Ontario-specific analysis uses
SRC_AGENCY == "ON". - Analysis: R with
tidyverse,sf,ggplot2,patchwork,maptiles,leaflet.
Began as coursework in environmental epidemiology at Oxford; extended with primary data analysis and spatial visualisation. Views are my own.