In 2019, I contracted cutaneous leishmaniasis during my time in Costa Rica. Luckily, I had access to treatment, but for many communities where it is endemic, it is truly a neglected disease. Neglected by global health funding, surveillance systems, and by predictive tools that exist for other vector-borne diseases. My home country, Morocco, has tracked cases of its only remaining endemic neglected tropical disease (NTD) at the province level for at least two decades. When I found myself working alongside regional epidemiologists at the Moroccan Ministry of Health in Al Hoceima in early 2025, I realized the data existed to do something more rigorous than the surveillance system was currently doing with it.
This project builds a risk model trained on this data, satellite climate observations, and the known ecology of Phlebotomus papatasi sandfly transmission. The full data pipeline, from bilingual Arabic-French PDF extraction to interactive choropleth, is open source.
Province-level cutaneous leishmaniasis incidence per 100,000 population, 2003–2023. Use the slider or play button to animate through years. Toggle between reported incidence and model predictions. Hover a province for case counts and residuals. Data: Morocco Ministry of Health · Climate: CHIRPS / ERA5-Land / MODIS via GEE.
The disease and its ecology
Cutaneous leishmaniasis in Morocco is caused by Leishmania major, transmitted by the sandfly Phlebotomus papatasi, with the fat sand rat Meriones shawi as the primary rodent reservoir. Its epidemiology follows a predictable ecological chain: rainfall triggers vegetation growth in arid pre-Saharan zones, which fuels rodent population booms, which in turn amplifies sandfly breeding that reaches humans typically with a lag of one to three years. Outbreaks alternate with multi-year remissions. Between 2003 and 2023, Morocco recorded over 91,000 cases nationally, concentrated in a handful of endemic provinces in the south and east.
The disease is not random but clusters geographically, responds to climate, and is predictable in ways that existing surveillance infrastructure does not fully exploit.
Data pipeline
Morocco’s Ministry of Health publishes case counts in bilingual Arabic-French PDF tables, with province names that vary in spelling across editions, administrative boundaries that changed in the 2015 reform, and newly-created provinces that split from historical parents at different points between 2004 and 2012. Getting to a clean, longitudinal panel was the messiest part of this project:
- Custom PDF extraction in Python (pdfplumber), built to handle the bilingual Arabic-French layout and 20 years of inconsistent province name spellings across editions
- Administrative reform harmonisation: the 2015 reform created 12 new regions from 16 old ones. Provinces were reassigned and mapped to both their pre- and post-2015 regional identity
- Split-province handling: 18 provinces created after 2004 were absorbed into their historical parents for longitudinal modelling consistency, with a separate raw panel preserved for recent-year mapping
- Climate extraction via Google Earth Engine: monthly CHIRPS rainfall, ERA5-Land temperature, and MODIS NDVI extracted per province polygon using covering 2001–2023 to allow up to 3-year climate lags
- Population interpolation: linear interpolation between the 2004, 2014, and 2024 census anchor years to compute annual incidence rates per 100,000
The full pipeline runs end-to-end from main.py and is documented at every step.
Model
The model predicts log-transformed incidence per 100,000 population (log1p), to handle the zero-inflation in non-endemic provinces without dropping them entirely. This approach keeps the model focused on explaining relevant variation within the endemic belt, as opposed to simply learning how to distinguish rural provinces from urban provinces as the single most important proxy at the national level.
Features fall into three groups:
- Province baseline: historical mean log1p incidence over 2003–2019, computed on training data only. This captures structural endemic risk without learning urban vs rural from administrative labels.
- Climate signals: annual and dry-season (June–September) totals for CHIRPS rainfall, ERA5 temperature, and MODIS NDVI — each with 1, 2, and 3-year lags. Wet-season (October–March) totals, peak rainfall month, summer temperature maximum, and NDVI range round out the feature set.
- Anomaly features: z-score deviation of each climate variable from each province’s long-run mean. Captures whether this year is anomalously wet or hot for this province, not just in absolute terms.
Training used an expanding-window temporal cross-validation over 12 folds (minimum 5 training years per fold). Hyperparameters were tuned via grid search across 144 combinations, evaluated on the coefficient of variation (CV) of the Root Mean Squared Error (RMSE). The hold-out test set is 2020–2023.
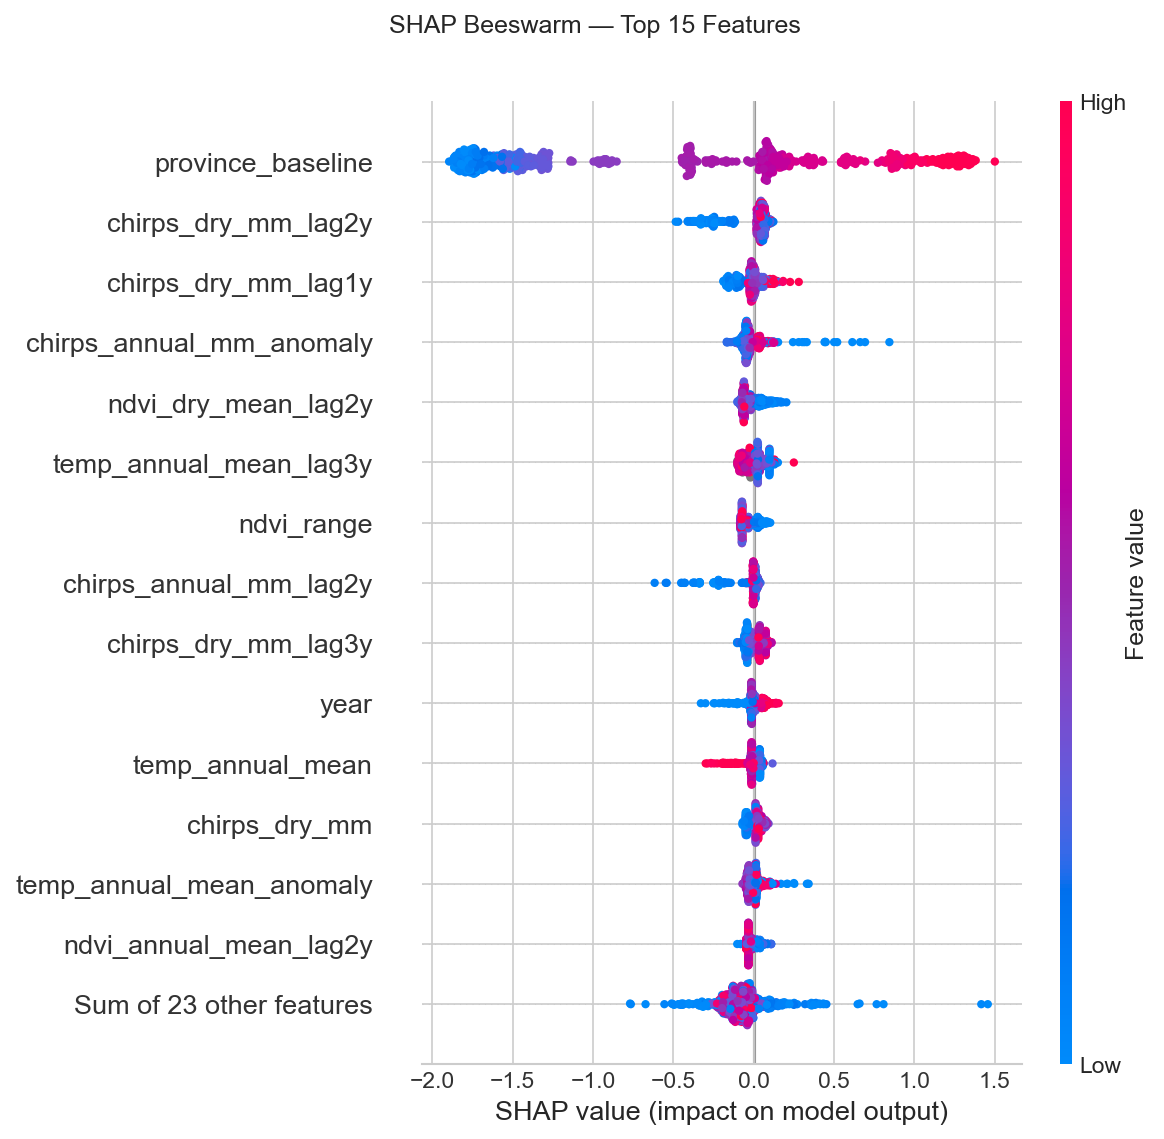
SHAP beeswarm plot showing feature contributions across all province-years. Colour indicates feature value (red = high, blue = low). Province baseline anchors structural risk; lagged dry-season rainfall and temperature drive year-to-year variation.
As expected, province baseline dominates structural risk (if a province had a high incidence rate in prior years, we expect the baseline risk to be similar in future years). However, the more interesting variables are the dry-season rainfall at 1, 2, and 3-year lags which clusters together with lagged temperature and NDVI features. This shows the vegetation-rodent-sandfly transmission chain at the satellite level, operating across multiple years. The 3-year lag featuring prominently is consistent with the biological literature: rainfall in year T triggers rodent population growth in year T+1, sandfly amplification in T+2, and epidemic transmission in T+3.
Results
Hold-out performance (2020–2023, unseen during training):
- Pearson r = 0.81
- R² = 0.65
- Median absolute error = 8.14 cases/100k
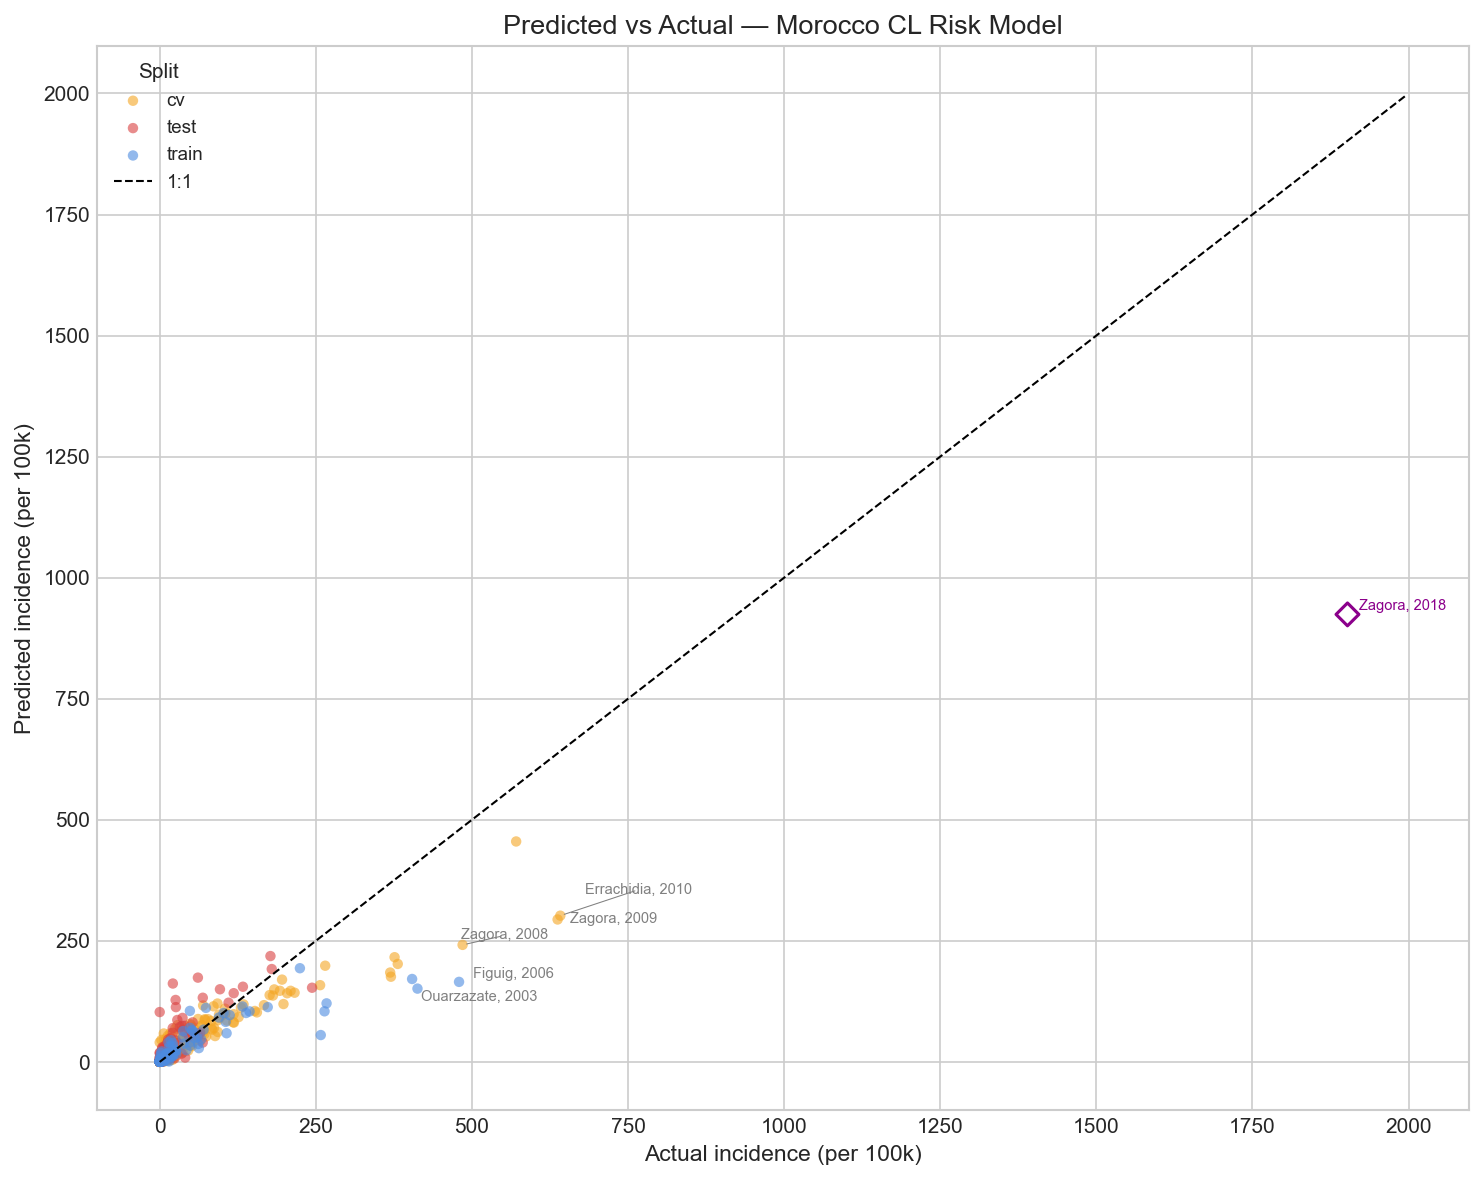
Predicted vs actual incidence per 100,000. Blue = training set, orange = cross-validation, red = hold-out (2020–2023). 1:1 line shown dashed.
The model captures directional risk well across endemic provinces, with Pearson r = 0.81 on completely unseen 2020–2023 data. However, the model systematically underpredicts incidence rates for the highest outbreak years: Zagora 2009 (actual ~637/100k, predicted ~260/100k) and Errachidia 2010 (actual ~641/100k, predicted ~150/100k) are both substantially underestimated. This is likely due to tree ensembles minimising average loss across all training rows and regressing toward the endemic mean rather than the full amplitude of outbreak peaks. Even with upweighting of high-incidence years, capturing outbreak magnitude at the extreme tail requires reservoir population data — rodent density indices, sandfly trap counts — not available at provincial scale from satellite observations alone.
The largest single residual is Zagora 2018 (actual ~1,900/100k, predicted ~530/100k). I have treated this data point as an informative outlier.
The outbreak the model couldn’t predict — and what that tells us
Zagora 2018 is the model’s largest residual by a wide margin. My first instinct was a data entry error, but it turns out that it was a well documented and unexpected outbreak. A 2019 paper in PLOS Neglected Tropical Diseases (El Hamouchi et al.) documented 4,402 confirmed cases in Zagora between October 2017 and March 2018. They concluded that the outbreak was caused by an explosion in Meriones shawi rodent reservoir density, linked to the deceleration of vector control measures following the post-2010 remission period. Once control programmes are scaled back after a multi-year lull, accumulated susceptibility in both the rodent and human populations creates conditions for severe re-emergence. This would be invisible in climate data, such that the climate signal going into this outbreak was even negative: Zagora’s 2016 rainfall anomaly was −0.72σ and 2017 was −1.70σ; among the driest years in the 21-year record. The model correctly interpreted these conditions as lower risk, but could not easily account for other transmission dynamics and vector control.
This example both shows the ceiling of climate-based early warning, but also its use case in guiding vector control programmes. Compare the two major Zagora outbreaks:
| Outbreak | Climate signal | Model | Driver |
|---|---|---|---|
| 2008–2010 | Strong positive anomaly 1–2 years prior | Good | Climate-driven |
| 2017–2018 | Negative anomaly in preceding years | Poor | Control programme relaxation |
Climate models provide actionable early warning for rainfall-driven outbreaks — the majority of epidemic years in the dataset. For susceptibility-driven outbreaks, they must be paired with surveillance of vector control programme continuity and rodent reservoir indices.
Province-level explainability: Chichaoua, 2023
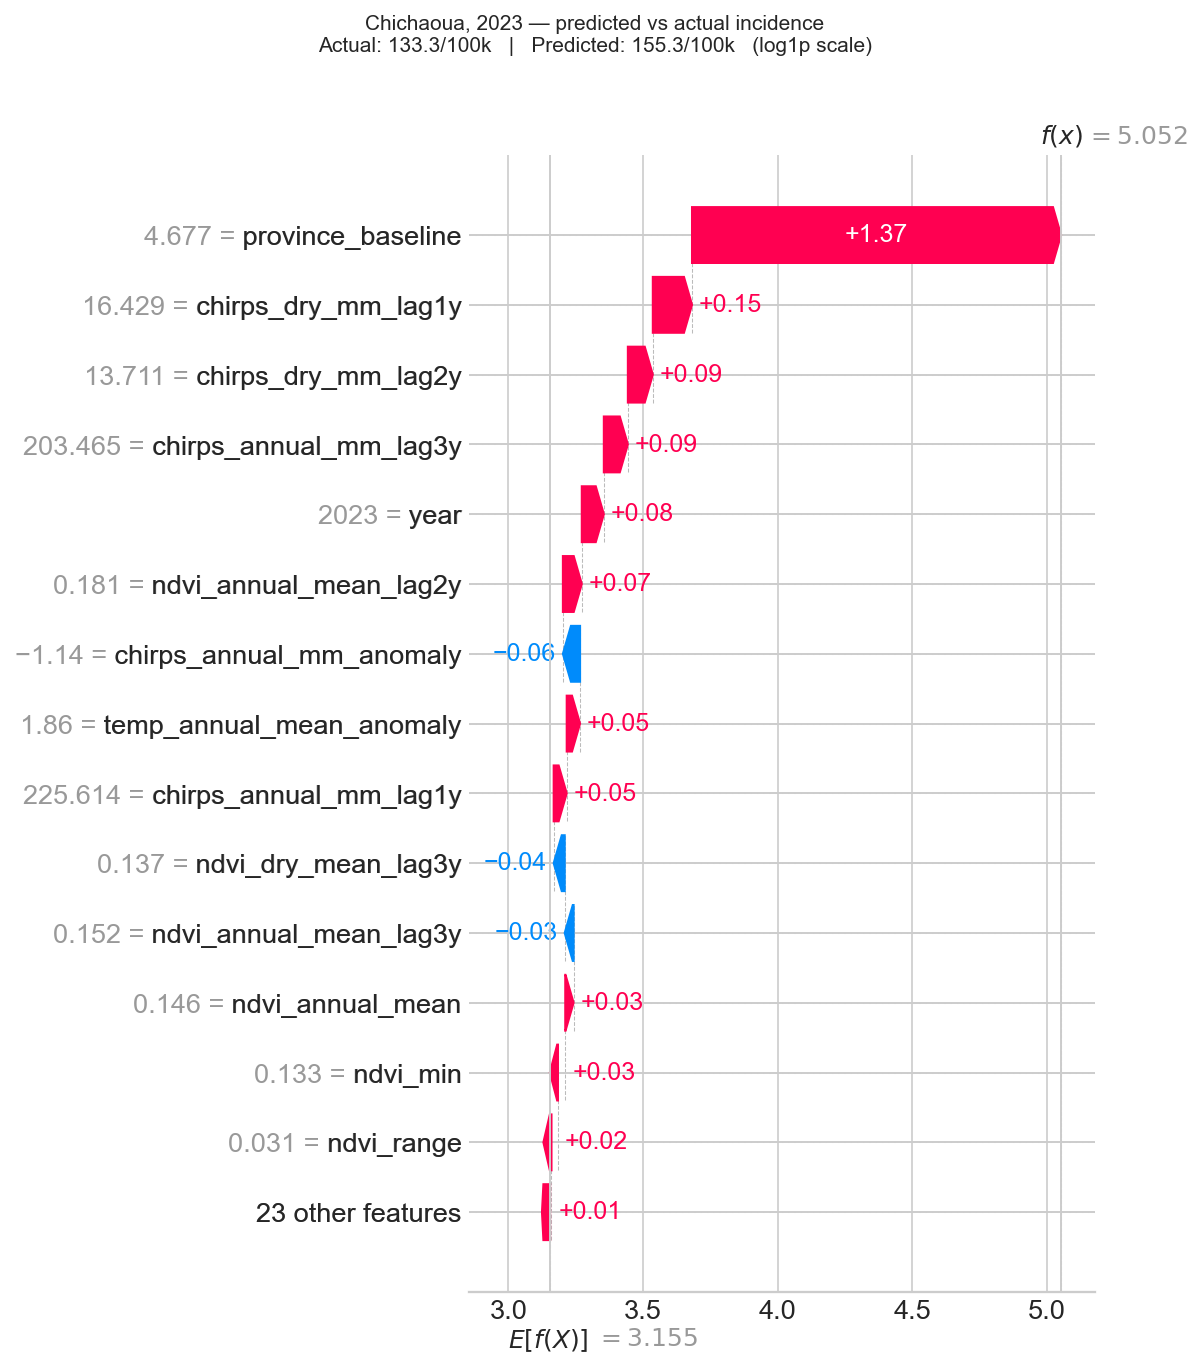
SHAP waterfall for Chichaoua, 2023 (test year unseen in training) Actual: 133.3/100k. Predicted: 101.7/100k.
Chichaoua is one of Morocco’s most persistently endemic provinces, close to Marrakech. For 2023 — a completely unseen hold-out year — the model predicted 101.7 cases per 100,000 against an actual of 133.3, a 24% error.
The waterfall shows how the prediction is assembled. The province baseline (+1.8) anchors it at Chichaoua’s structural risk level. Lagged dry-season rainfall (+0.09 at lag1, +0.07 at lag2) and lagged NDVI (+0.06) push the prediction higher, reflecting wet conditions in 2021–2022. A negative annual rainfall anomaly (−0.06) partially offsets this, since 2023 itself was drier than usual. However, the reservoir dynamics built up in prior years dominate, building a solid case for the aforementioned biological mechanism.
Data and methods
All data are open-access. The full pipeline is reproducible from main.py.
- Surveillance data: Morocco Ministry of Health Santé en Chiffres (2003–2015) and Maladies à Déclaration Obligatoire tables (2016–2023). Extracted from PDFs using custom Python pipeline; province name harmonisation via canonical map.
- Climate: CHIRPS v2.0 daily precipitation (summed monthly), ERA5-Land monthly
mean 2m temperature, MODIS MOD13A3 monthly NDVI. Extracted via Google Earth
Engine
reduceRegions()at 5km resolution per province polygon. - Population: Morocco HCP census anchors (2004, 2014, 2024), linearly interpolated. Province boundaries from geoBoundaries MAR-ADM2.
- Model: XGBoost regressor. Target: log1p(incidence/100k). Expanding-window temporal CV, 12 folds. Grid search over 144 hyperparameter combinations. Hold-out: 2020–2023.
- Stack: Python —
pdfplumber,geopandas,xgboost,shap,folium,earthengine-api.
This project began during my internship at the Moroccan Ministry of Health (Service des Réseaux des Etablissements de Santé) in Al Hoceima. Views are my own.